Overview
The movie industry has long been criticized for its lack of diversity both on and off screen. Despite numerous efforts to address this issue, the representation of marginalized groups remains inadequate, with many voices and perspectives still underrepresented or completely absent from mainstream films. This lack of diversity not only perpetuates harmful stereotypes and biases, but it also limits the stories and perspectives that are told and perpetuates a narrow and limited view of the world.
Data and Intial Analysis
In this project, we use a combination of different datasets:
- CMU Movie Summary Corpus which contains over 40,000 movie plot summaries extracted from Wikipedia and also metadata such as characters, genre, release date information.
- Wikidata from where we extracted additional movie metadata and extending the CMU Movie dataset.
- OpenSubtitles from which we were able to extract over 20 000 english subtitles and map to our existing data.
- Consumer Price Index for All Urban Consumers To study the revenue we first need to adjust the revenue according to the inflation rate. To this end we use the inflation rate data from Federal Reserve Economic Data. Since this inflation data goes all the way back to 1913, therefore, it lends itself to our analysis of film revenues beginning in the early 19th century.
To give our readers a brief view of the data we use, we plot out the top 21 genres in the dataset we combined in Figure 1.
From the plot we can see that in this dataset most movies produced in history belong to the category of drama film and the distribution is indeed a long-tailed one.
To study the revenue we first need to adjust the revenue according to the inflation rate. To this end we use the inflation rate data from Federal Reserve Economic Data1, specifically the Consumer Price Index for All Urban Consumers. Since this inflation data records CPI from year 2022 and goes all the way back to 1913, therefore, it lends itself to our analysis of film revenues beginning in the early 19th century. The adjustment is done by multiplying the inflation rate factor to the movie revenue.
The inflation rate multiplier for a year \(r_{year}\) is calculcated as
\[r_{year} = \frac{CPI_{\text{2022}}}{CPI_{year}}\]Then the movie revenue for a specific year is adjusted by multiplying the revenue by this multiplier, and we show the revenue for the top 10 movie genres in Figure 2.
Our Focus
To find out what it was like it the history of movie industy, we devised our reseach questions into two categories: On screen and Off screen where we will take a deeper look at the diversity in the movie industry.
Diversity Off Screen
Director, Casts, Producers… The people who make the magic happen
Diversity On Screen
Gender, Race, Height… Everything you see on screen
Diversity Off Screen
Gender
Throughout the history of the silver screen, not many talented women have been recognized for their work as directors in the film industry. Notably the first woman to have won an Oscar for directing is Kathryn Bigelow for her work on the war film “The Hurt Locker.” This happened in 2010, 81 years after the creation of the Academy Award for Best Director and only four women were nominated before that.
On the other hand one could argue that Academy Awards don’t represent a success of a movie and can be very arbitrary, even great Scorsese had to wait seven nomination before getting his Oscar. This is why we decided to measure the success of a movie by looking at the impact of the gender on the revenue.
So a natural question to ask is
Does the gender of lead actor or director impact the revenue of a movie?
Since for nearly all the data that we had, the gender was either male or female and that we do not have the data to determine whethever the gender was changed to another gender before the movie was released, we decided to base the gender diversity analysis on only male and female.
Let’s first check if there a significant difference in number of movies directed by men vs women
Only around 1/3 of the leading roles are occupied by women and nearly all the main directors and producers roles are being held by men. Fortunately, we can see a trend of the gender gap closing slowly.
Of course, we cannot generalize this for every genre since one might argue that in some genres, such as action and adventure, there may be a greater proportion of male leading roles, while in others, such as romantic comedy and drama, there may be a greater proportion of female leading roles. And indeed, we see that e.g. the gender proportions are different between romantic and action films. In general, we can see again, that the gender gap is closing, however, they are still mostly dominated by males!
We now want to know if there is a relation between the gender and the revenue of movies.
Here we actually seem to see the opposite as above. Instead of the gender gap closing, it now gets bigger with increasing box office value. One might make the assumption, that movies with lead actors might actually by more successful wrt. to the box office value than movies with leading actresses. However, after performing linear regression and hypothesis testing, we can safely say that we fail to reject the null hypothesis that whethever a cast is diverse or not has no effect on the box office value which is also validated by the confidence intervals overlapping.
Age
Let’s now turn our focus to another simple yet widely used metric to determine the diversity of a community - age. Some may be thinking that a film representing a diverse age group may be relatable and resonate with a larger audience thus leading to a higher chance of success on the market. So the myth we want to find out is
Would a more diverse cast in terms of age help achieve higher box office revenues?
In this part we will try to see if this is just a myth or another secret key to achieve success and fame on the silver screen.
To begin with let’s calculate two metrics that reflect the diversity in age of the cast members: mean age of top 5 casts and max difference in age of top 5 casts. And then we performed a regression analysis to study the correlation between mean cast age, max cast age difference, and movie genres to the movie box revenue which the results showed insignificant correlations. After, we divided and aggregated the movies for every ten years and anylze them in their own genres, and visualized the relationship between these two variables and the revenue as shown in Figure 6.
From these two plots we can see that the relationship between either mean cast age or max cast age difference and the revenue is not linear and consistent. And we can also see that the relationship between the two variables and the revenue is not the same for every genre. For example the movements of bubbles in both plots cannot be easily discerned, therefore “having higher diversity in cast age leads to higher revenue” might just stay as a myth.
However, one of the interesting trends we find in these two plots is that we do see that the average and maximum age differences across all genres have become more concentrated in the last 20 years, which could mean that the opposite trend in diversity of cast age is happening in the film industry right now.
Diversity On Screen
Ethnicity
Are the Hollywood stars just like us?
TLDR: No, they are taller and less ethnically diverse compared to the average American.
Using the ethnicity, gender, height and age in CMU dataset we want to analyze how comparable are movies with the average population of its countries and how did it change over time.
Lets look at the change in USA population over time:
First of all the Latino population in the United States is the most quickly growing population group these past few decades. According to the United States Census Bureau, the Latino population in the U.S. grew from 3.2 million in 1950 to 62 million in 2020, with an increase of nearly 70% over the past 20 years.
But looking at the diversity of movie characters, we notice something interesting: there is a striking difference when it comes to Hispanic representation.
The share of Hispanic characters has been stagnating between 3% and 5% since 1980s. While this can be partially explained by Latino population’s heavy consumption of South American media this doesn’t change the fact that, there is still much work to be done as when we see a lack of Latino characters on screen, it sends the message that their stories and experiences are not important or valued.
Another interesting thing to note is the growth and fall of African American representation which corresponds to the rise and fall of Blaxploitation films. These were a genre of movies, that isn’t very well know in Europe, that emerged in the 1970s and initially aimed at a African American audience. These films featured a mostly African American cast and often depicted themes of crime, violence, and empowerment, but they were also controversial in their portrayal of African American culture and were often accused of perpetuating negative stereotypes.
The CMU dataset also contains height, and there is some evidence that height can be correlated with certain forms of success, particularly in fields where physical appearance is important or where height is directly this is why we decided to compare the height of Hollywood actors and the US population2.
Comparing these two we see that for almost one hundred years we analyse whe average height was around 180cm for men and 165cm. These values are quite close to the current population means. But in 30’s and 40’s and actor was on average 10cm taller than an average American man.
Sentiment Analysis
Is the language spoken in movies biased?
To gain deeper insight into the language used in movies, we run experiments of OpenSubtitles corpus, which is a collection of translated movie subtitles from opensubtitles. We matched 27,329 subtitles from the corpus with the CMU dataset and extracted 74,518,995 tokens after lemmatization and stopword removal. We then split the corpus into 5 bins comprised of an equal number of tokens to compare the language across years.
For each keyword, we extracted both fix-sized context windows and dialogue sentences from subtitles and predicted their sentiment class with a transformer-based sentiment analyzer, roBERTa-base.
In the graph bellow, we analyzed the emotion behind the occurences of words in subtitles. This allows us to see if terms such as “gay” are discussed in positive, neutral or negative context.
At first glance, we observe an overall negative sentiment for LGBTQ+ keywords compared to man and woman throughout the span of the dataset. What is more interesting is that the mean sentiment score for keywords gay and queer (which are the most frequent terms) even decreased compared to 1972 and before. This hints at the usage of non-binary terms in negative contexts with verbal slurs more often in movies. As our dataset does not include recent movies, we don’t see the effects of increased sensibility toward gender equality.
To demystify the plot above, we first point out two key elements. First, we realize that all the sentiment scores are below zero. The reason behind this is 54.4% of analyzed sentences have a sentiment label Neutral, followed by 29.0% Negative. Another point to notice is the large 95% confidence interval bars for some entries. This due to having too few samples for those keywords in the respective year intervals.
As for the ethnicity-related keywords, the decrease in the sentiment of the term mexican is distinguishable from the rest. Upon further inspection, we further realized that this is a reflection of the societal tensions in topics connected to immigrants. In addition, the sentiment towards russia is also distinctively negative; however, it starts to raise after the dissolution of the USSR (as a word soviet was used in similar negative contexts before).
The Evolution of Words
Inspired by the evolution analysis3 of words we decided to study how semantic use change specifically when it comes to Hollywood movies. As the initial study was done on a collection of English language books, which is quite different from the daily spoken familiar language we often see in movies and we wanted to see what are the potentiall differences in semantics between these two.


As expected we see that he word gay has undergone significant semantic change over time. Originally, the word gay meant happy or carefree, and it was used as an adjective to describe things that were joyful or bright. However, in the 20th century, the word began to be used more frequently as a noun to refer to people who are attracted to members of the same sex. This can be clearly seen from its usage in movie subtitles.
When it comes to the usage of the word woman, we see that initially it was heavily connected to familly and children and over time it got much more sexualised. If this is connected to the sexual liberation or sexualisation is left upon the reader to decide.
On the other hand the usage of the word man didn’t change as significantly, only loosing its connection to soldier over time.
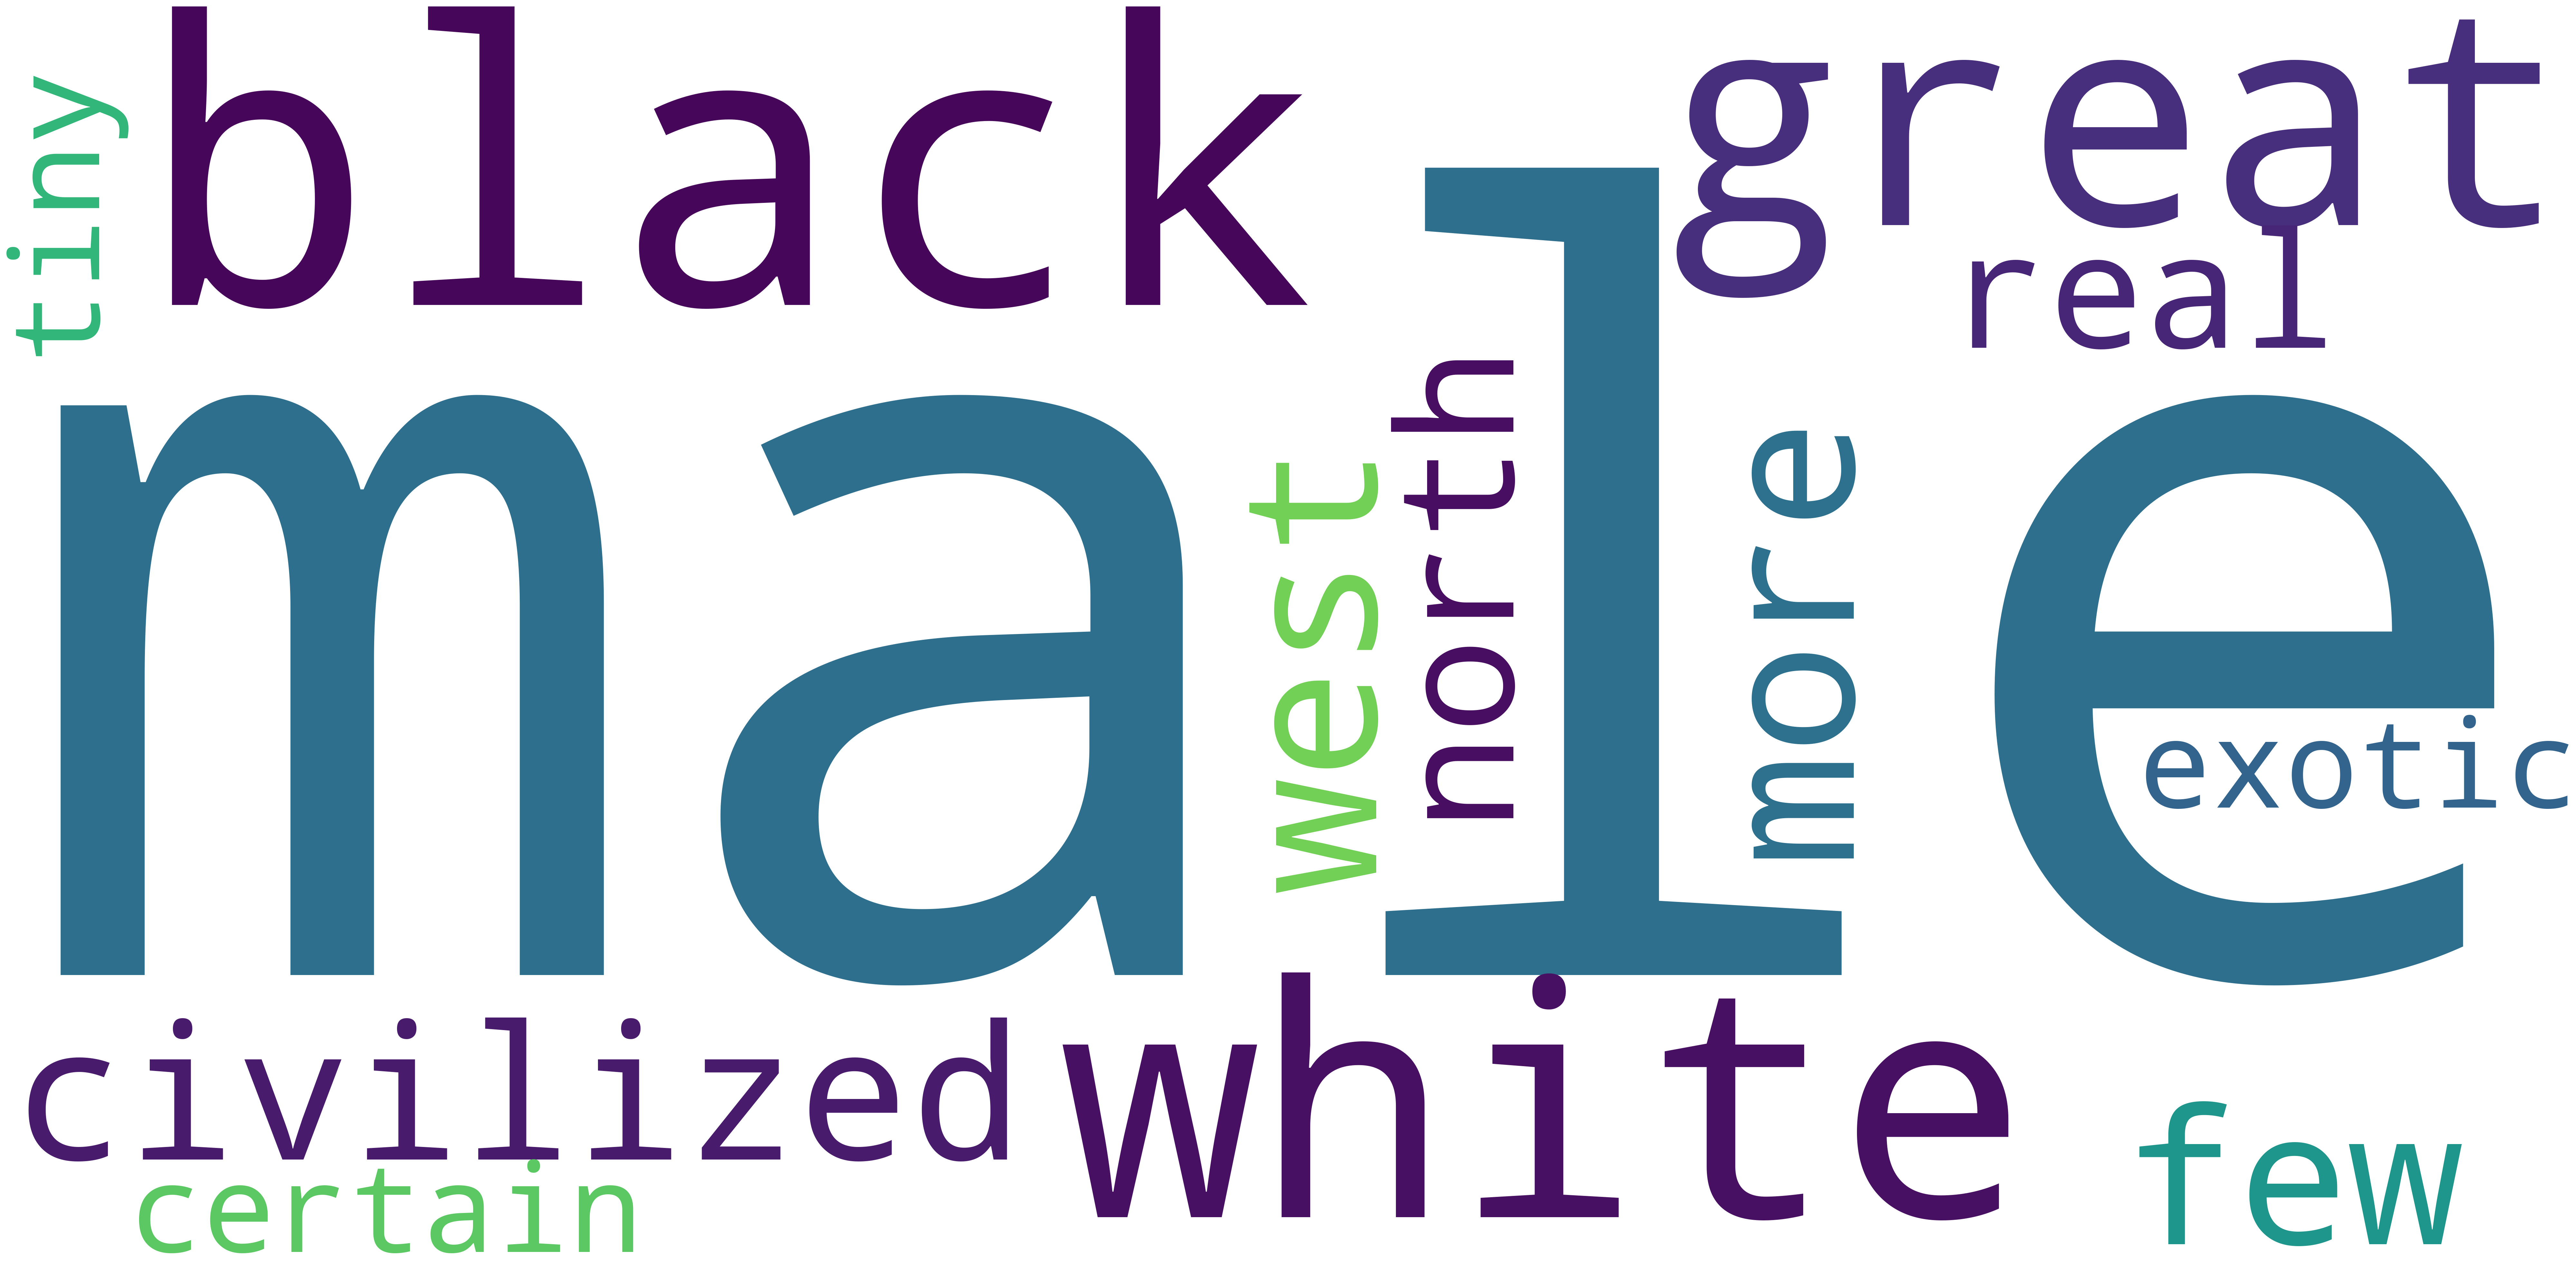
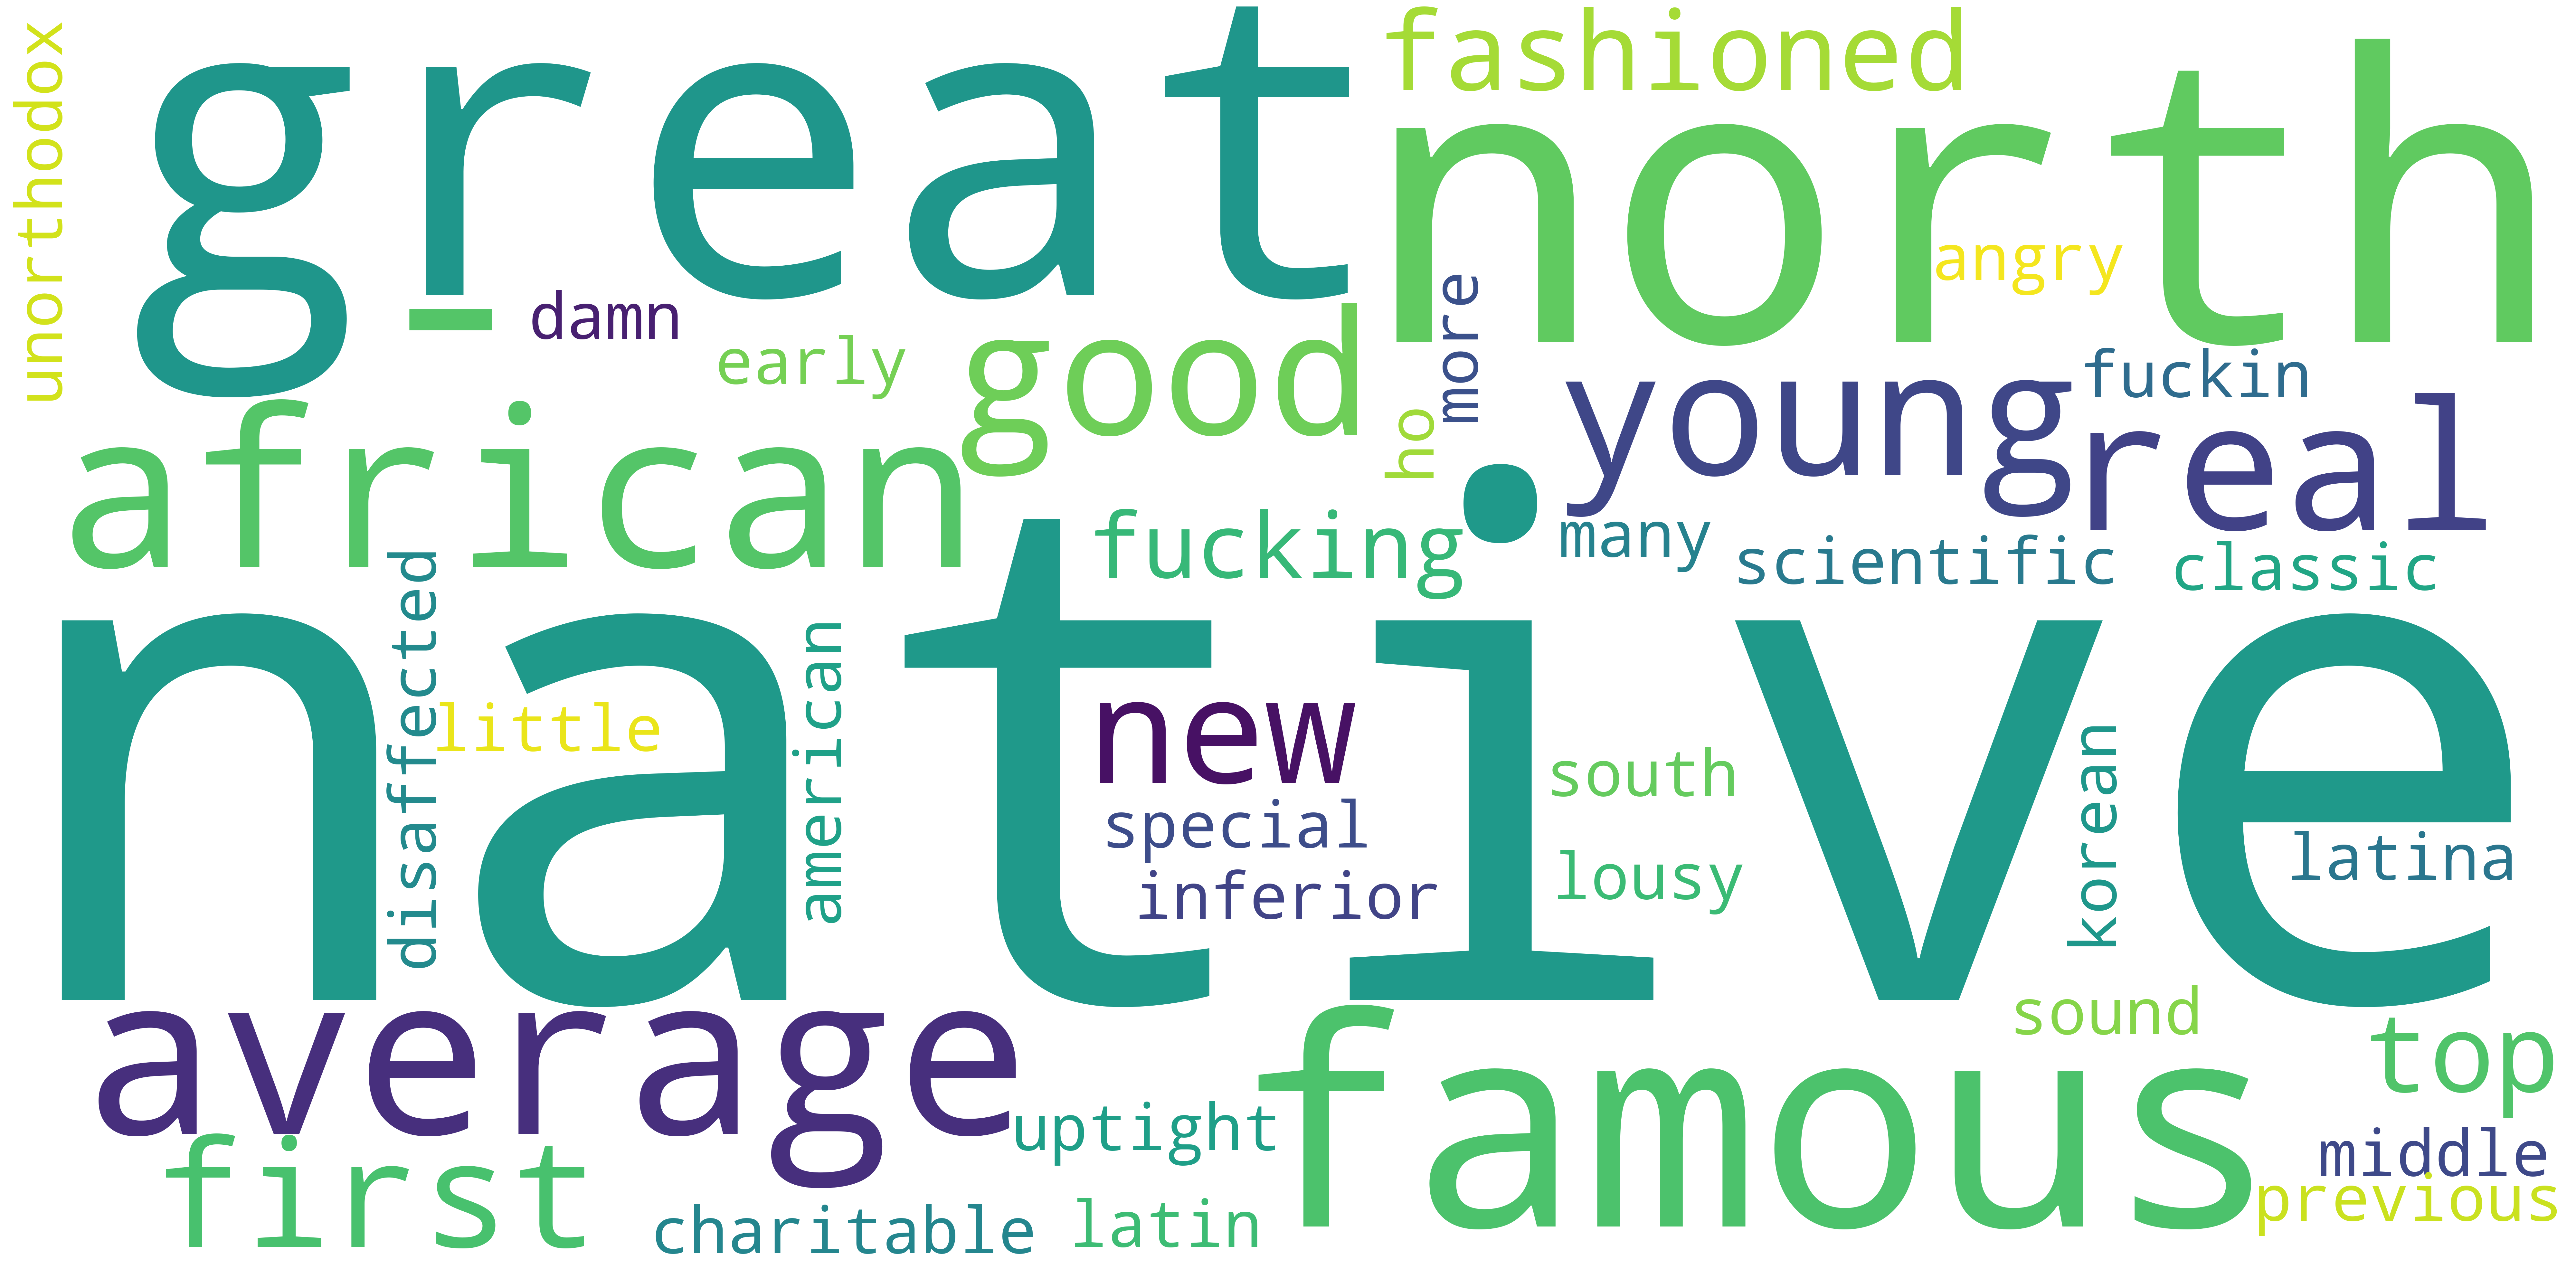
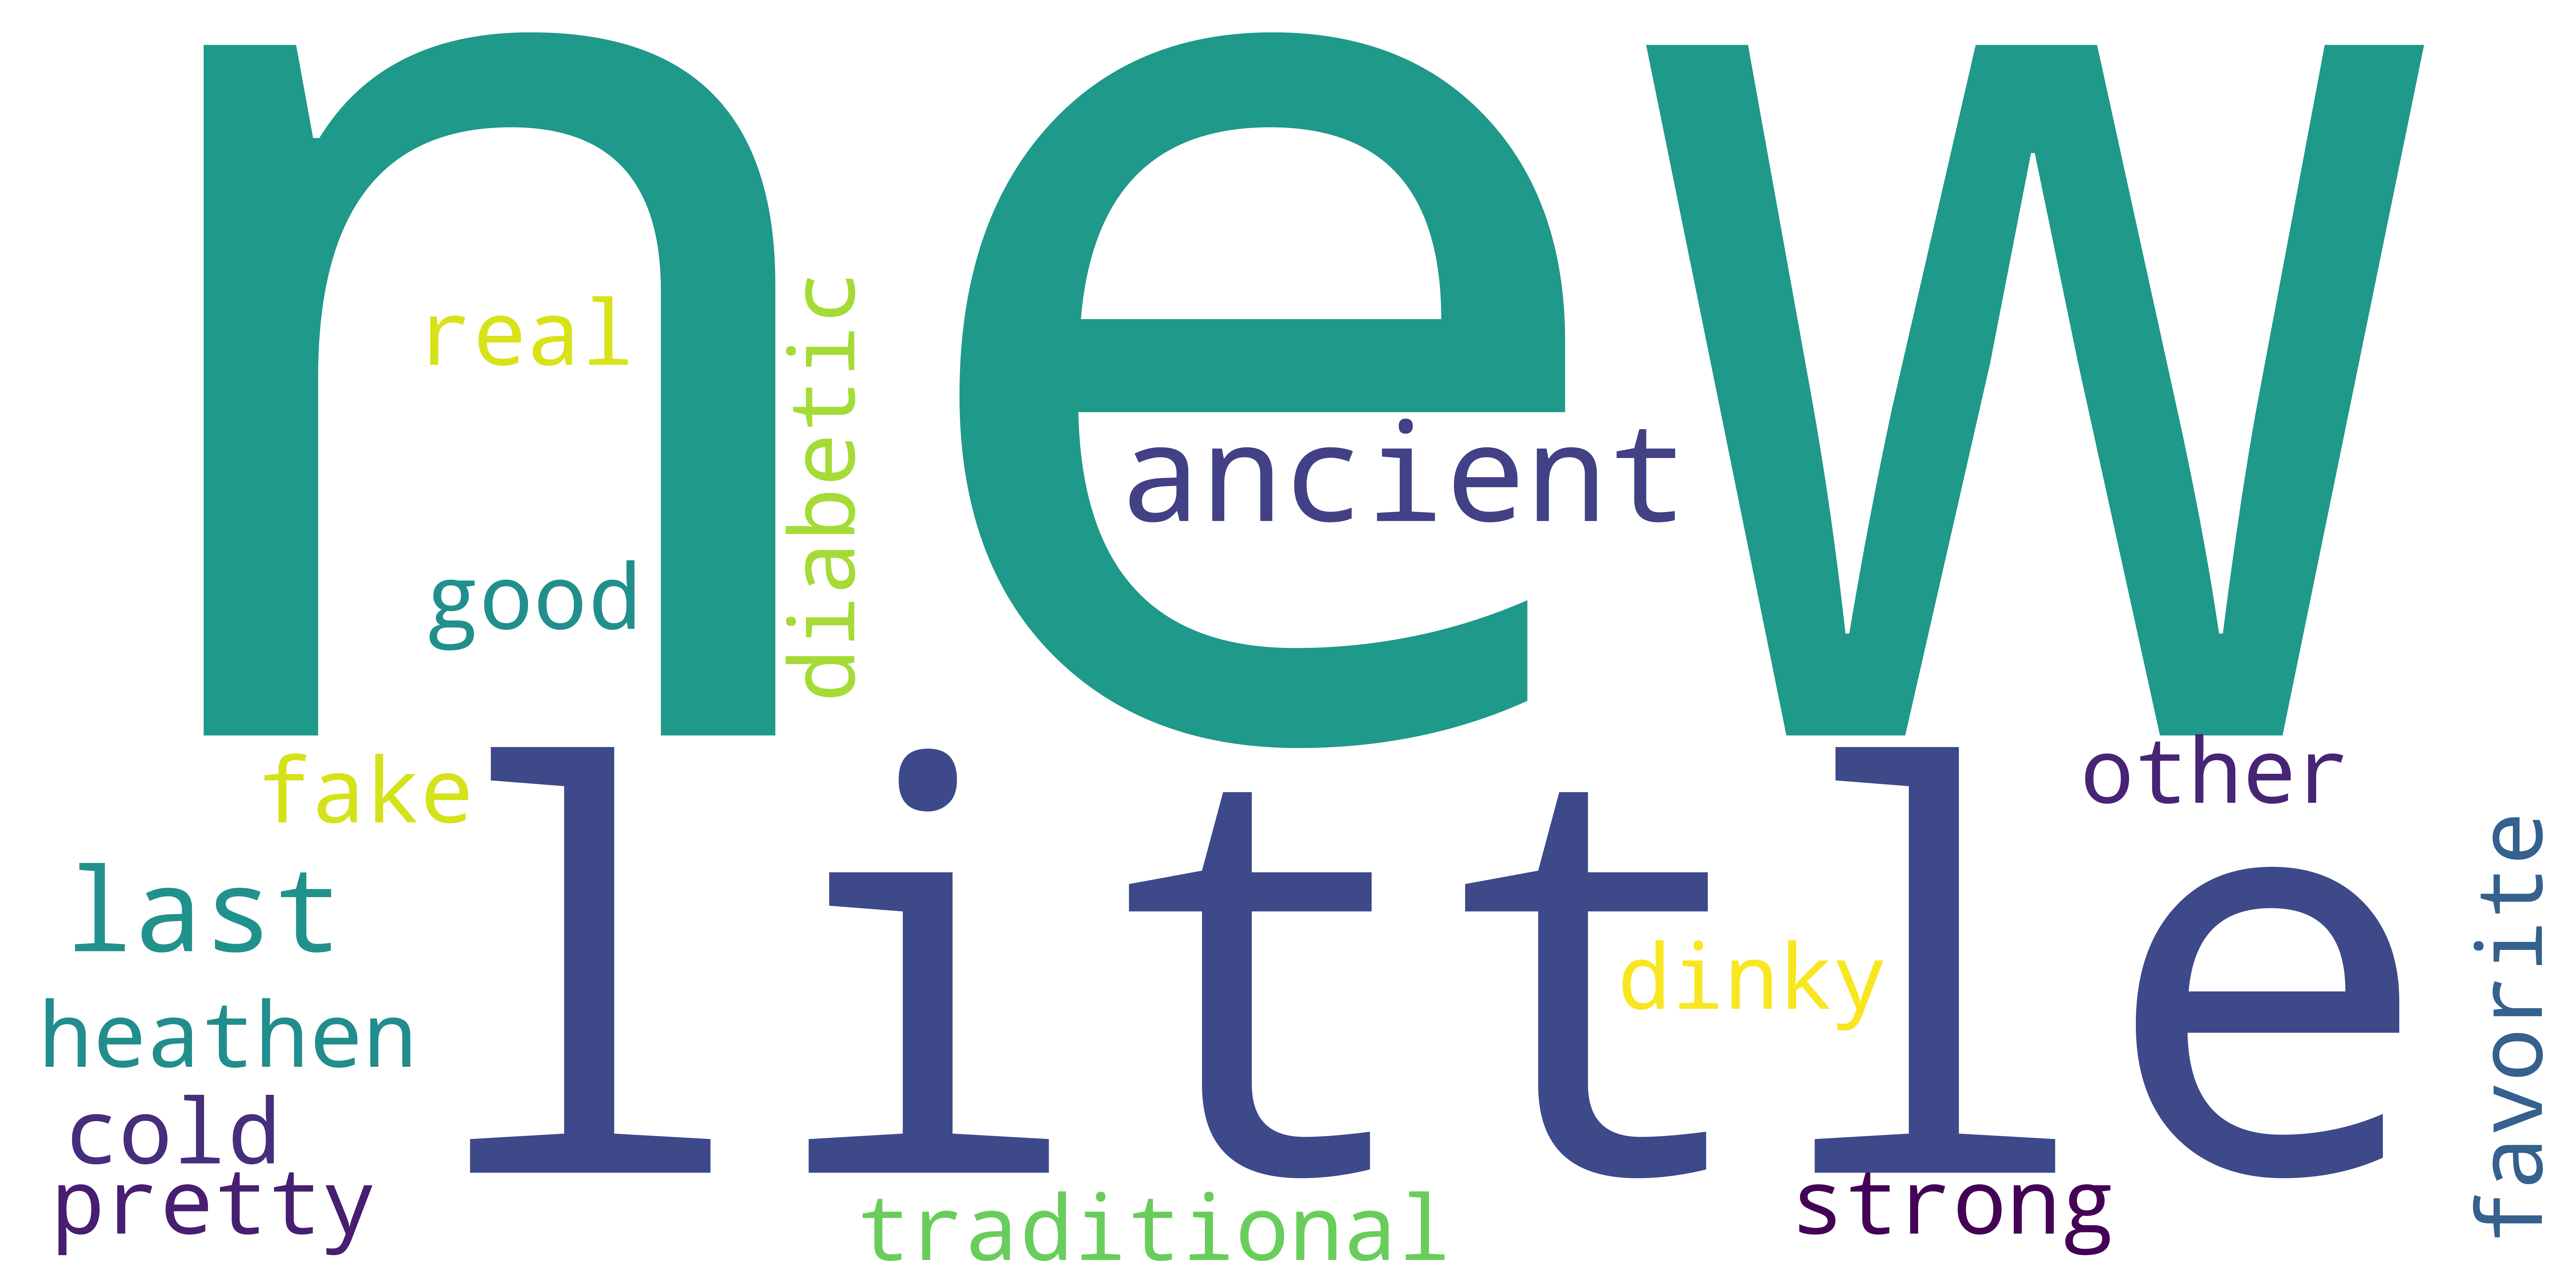
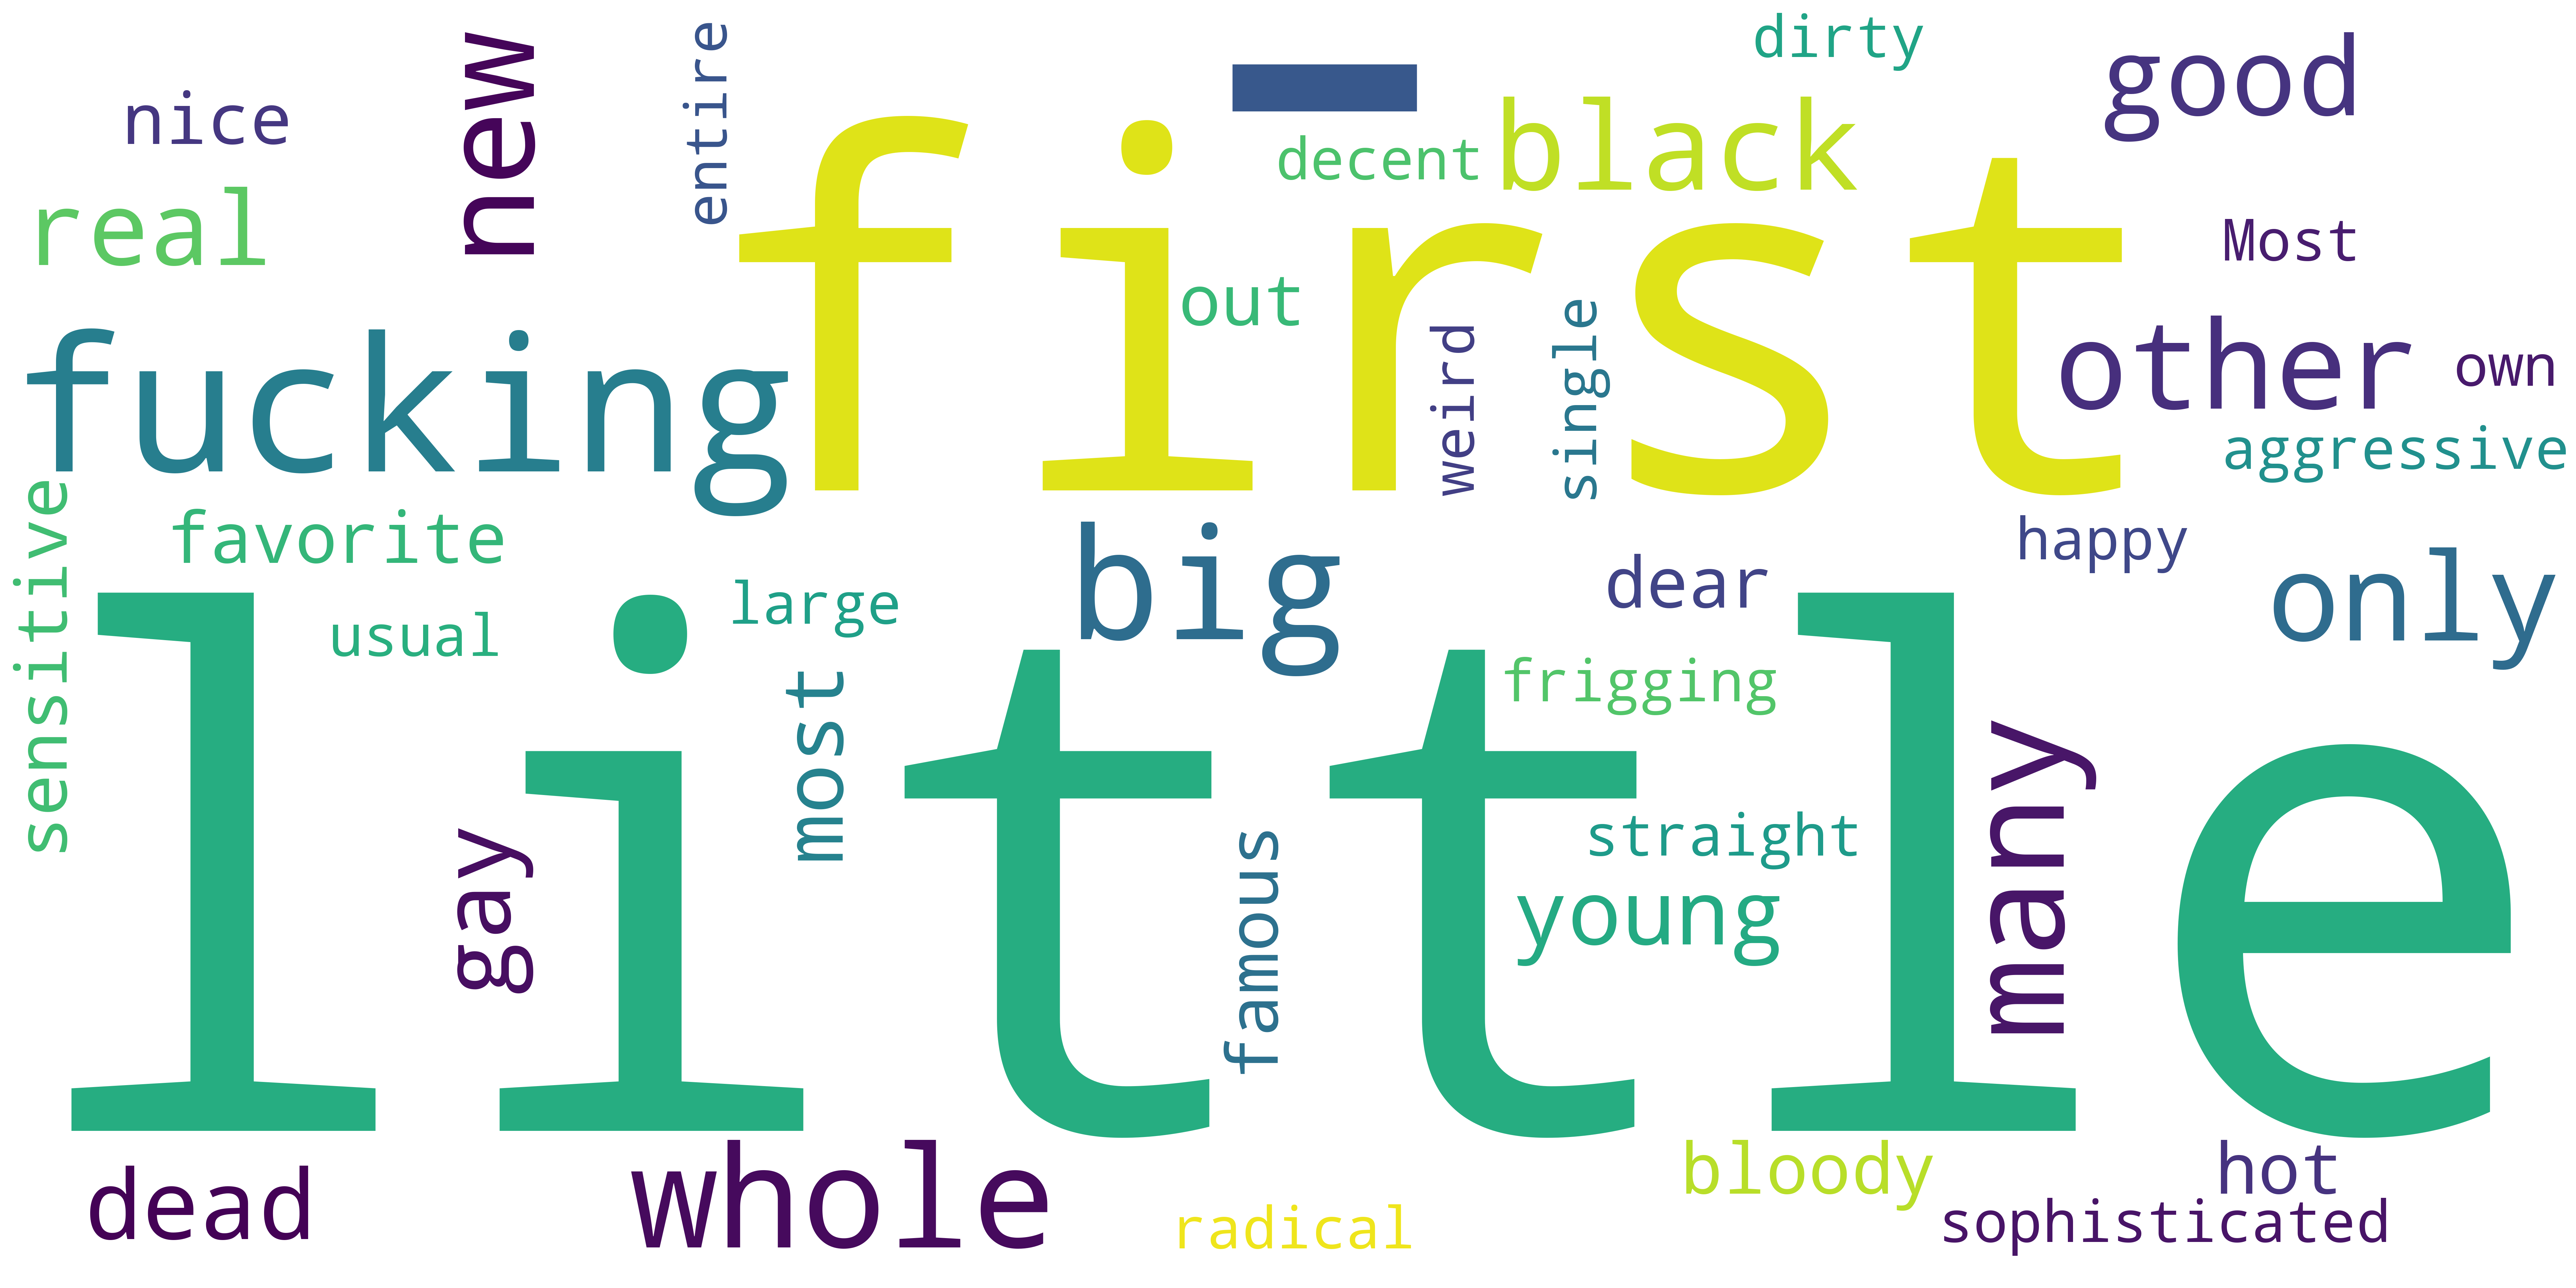
Word Cloud
In this part we decided to look at what are the most popular adjectives describing gender, ethnicity and sexuality. Here we can see the frequency of stereotypes, remarking that the most popular adjectives are heavily stereotypical taling about dangerous Mexicans, fat Indians and stunted bisexuals.
You can click on each image to look at the words in more detail.
African
American

Bisexual
Chinese
Gay
Indian
Lesbian
Man
Mexican
Queer
Russian
Woman
Conclusion
Despite the glitz and glamour of the film industry, it has long struggled with a lack of diversity that extends beyond the silver screen. Behind the scenes, marginalized groups have been underrepresented or completely absent from key roles as directors, producers, and more. On screen, the stories and perspectives of these groups have also been overlooked or distorted, perpetuating harmful stereotypes and biases. However, in recent years, a movement has emerged to increase diversity and inclusivity in the industry. While progress has been made, the road to true representation is long and winding. To fully embrace the uniqueness and diversity of the human experience, the film industry must continue to push for greater representation and inclusivity in all aspects of movie-making. Only then will the stories of all people be told and celebrated on the big screen.
References
-
What is FRED? https://fredhelp.stlouisfed.org/fred/about/about-fred/what-is-fred. ↩
-
Human Height by Max Roser, Cameron Appel and Hannah Ritchie https://ourworldindata.org/human-height ↩
-
The evolution of LGBT labelling words Yaqian Shi and Lei Lei https://www.cambridge.org/core/journals/english-today/article/abs/evolution-of-lgbt-labelling-words/C49EC6FDFA6117CB4DD69E16260DE005#article ↩